Data Acquisition System for Synchronous Generator Transient Performance
| Sponsor | SEL
|
| Team Name | PREW Generation |
| Duration | Fall 2018 - Spring 2019 |
| Faculty Advisor | Dr. Brian Johnson
|
| Mentor | Hussain Beleed
|
| Clients | Dr. Normann Fischer / SEL
Matchyaraju Alla / SEL |
| Team Members | Abdulwahab Aljabrine
ZhenWei Wu Renjie Xia Elliott Sher |
| Acknowledgements | Dr. Herbert Hess
Andrew Miles Chad Vorse |
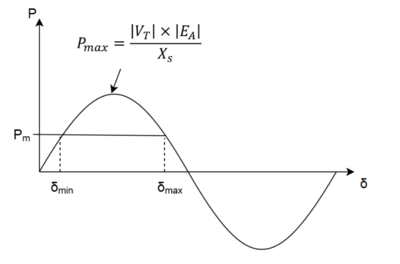
When a fault occurs in a system with a synchronous machine, the generator angle will increase and may behave as motor after the stability boundary has been exceeded. If the generator angle exceeds 𝛿max, shown below, the generator will slip a pole.
To combat this problem, it is necessary to create a fully automated system to acquire measurements from a synchronous generator under transient conditions. This project collects measurements such as speed, torque, load phase angle, terminal current, terminal voltage, field current, field voltage, and power from the system. This data will be used to create software and hardware to capture irregular measurements and protect the synchronous generator from their deleterious effects.
Project Scope[edit | edit source]
This project requires selection, installation, programming, and reading of several sensor devices. The captured data must be synchronized and correlated carefully. Data must be transmitted to storage for retrieval on demand. Analysis of data in real time to determine appropriate response is an option. This project has the opportunity to operate several products from National Instruments to acquire data.
Design[edit | edit source]
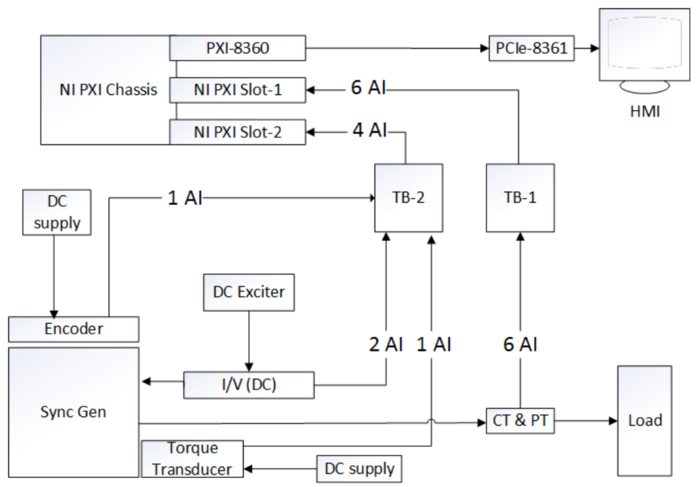
This is the data acquisition system topology. There are a total of 10 differential analog signals measured by both data acquisition devices, the PXI 6251 and the PXI 6289.
Hardware Devices[edit | edit source]
National Instruments[edit | edit source]
PXI 1052[edit | edit source]
This data acquisition chassis PXI-1052 has several mounting slots for various data acquisition devices.
PXI 6251[edit | edit source]
This data acquisition board is synchronized with the PXI 6289 and acts as a master device.
PXI 6289[edit | edit source]
This data acquisition board is synchronized with the PXI 6251 and acts as a slave device.
PXI 8360[edit | edit source]
This device is mounted in the PXI 1052 chassis and communicates with the PCIe 8361 in the PC.
PCIe 8361[edit | edit source]
This device is mounted in the PC via PCI and communicates with the PXI 8360 in the data acquisition chassis.
TB-2706[edit | edit source]
Analog signal measurement cables are screwed to the pins of these shielded terminal blocks. One block is screwed to each data acquisition board.
Shunt Resistors[edit | edit source]
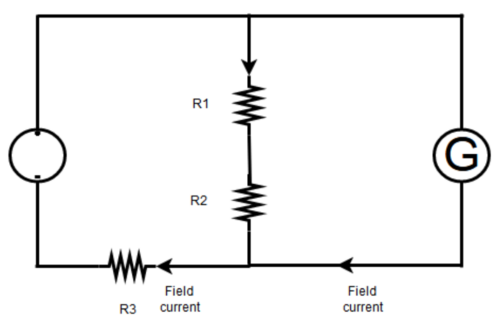
For the DC circuit shown in Fig 2, the maximum field current under transient conditions is 20A and the maximum field voltage under transient condition is 150V. The rated field current is 8A and the rated field voltage is 110V. The shunt resistor R1 is 20kΩ (10W) and R2 is 1kΩ (10W). These are high resistance in order to force most of the DC current to the generator and I1 can be negated. Field voltage can be measured by the voltage across R2. The voltage divider steps down the DC voltage by a factor of 21. The value of R3 is 0.1Ω (50W) to avoid sharing too much DC voltage with generator side (R1 and R2) and to allow the field current to reach near its maximum rated value. The ratio for field current measurement is 10.
Transformers[edit | edit source]
The data acquisition boards accept a voltage input with a range limitation of ±11V. Transformers are necessary to step down terminal voltage signals and line current signals into this range. For the current transformers, 1Ω shunt resistors were connected in parallel with the output of the through hole current transformers to acquire the signals as voltages. The FS24-500 PT and 114-151 CT were used.
Encoder[edit | edit source]
An incremental encoder was implemented to measure speed. The device used is the BEI Sensors H25 Incremental Optical Encoder. This is a rotating electromechanical device with three output signals: A, B, and Z. Z signal was used to indicate where the encoder is with respect to a particular reference position
Torque Transducer[edit | edit source]
The Himmelstein MCRT 48202(1-3) includes a 2-pin DC power input, a 3-pin RS232 digital communication port, and a 4-pin analog communication port. The digital communication port communicates with the Himmelstein DT482 software through an RS232 to USB cable. The DT482 software reports back the current torque value in Newton meters and also has zeroing and filtering capabilities. Pin 1 and 2 of the analog port output a DC signal with magnitude proportional to the current torque value. Pin 3 and 4 are used for calibration. The analog output includes induced harmonics and the average torque value can be calculated from the waveform peak divided by 1.18.
Software[edit | edit source]
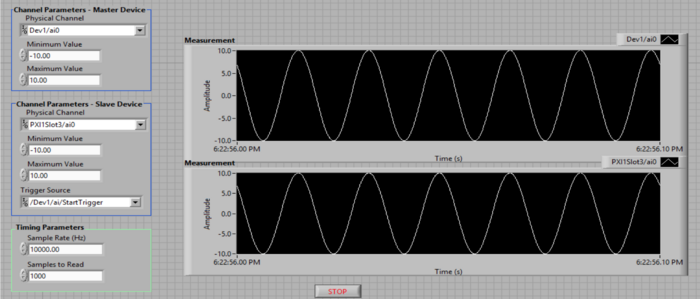
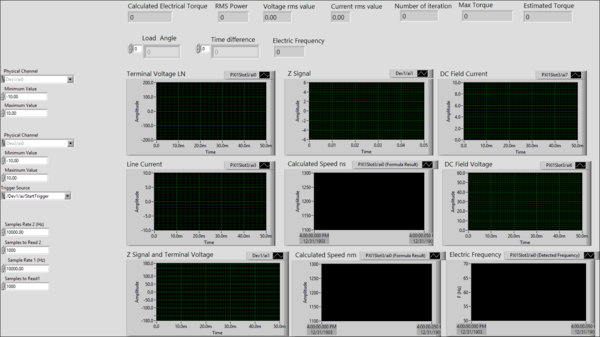
National Instruments LabVIEW was used for its natural compatibility with other National Instruments devices. Both data acquisition boards were synchronized in LabVIEW and share the same internal time base clock. The LabVIEW front panel window view was used to display all measurements simultaneously. The data was stored locally on a PC.
Shown is an identical signal captured by each data acquisition board with no time skew.
Experimental Results and Validation[edit | edit source]
AC Voltage and Current[edit | edit source]
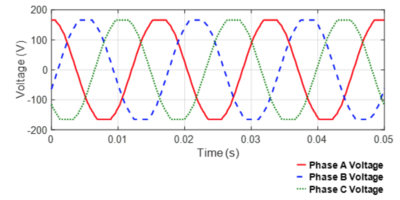
Once the transformers and DC circuit step down the AC and DC voltages and currents, they must be multiplied back up to their original values in LabVIEW by their respective step down ratio. The actual ratio of the potential transformers we used differed from the data sheet, causing the voltage outputs to exceed the ±11V range specified by the DAQ. The peaks of the line to neutral voltage waveforms are clipped, shown below.
Three Phase line to neutral voltage waveforms
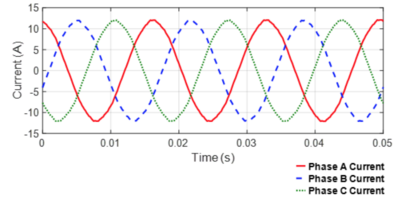
Three Phase line current waveforms
DC Voltage and Current[edit | edit source]
For capturing the field voltage and field current, the result is around 45V for field voltage and around 4.5A for field current. These values are not at the rated conditions of 110V and 8A because the machine couldn't run at full load conditions.
Load Angle[edit | edit source]
To measure the load angle, the load angle value under no load conditions was first measured and stored. This can be calculated using the following formula, where T is the period of the voltage waveform and TNL is the time difference between a rising zero crossing of the terminal voltage and a sequential Z pulse.
To calculate the load angle, ẟ, the process to calculate θNL was repeated with the machine under load. The following formula is then used to calculated ẟ.
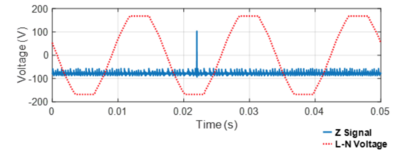
The load angle is defined as electrical difference between the angle of the armature voltage, Ea, and the terminal voltage. If the armature and terminal voltage are identical in both magnitude and phase, the load angle will be zero. Shown below is the time difference of phase A terminal voltage and the encoder Z signal. These are sampled simultaneously through LabVIEW and the load angle was obtained through calculation.
Terminal Voltage Waveform and Encoder Pulse Signal
Torque[edit | edit source]
The DT482 software was used simultaneously with the analog magnitude captured in LabVIEW. A resistive load on the machine was varied to create different torques on the shaft. These measurements can be exported to an excel file and plotted against each other to map the analog magnitude to a value in Newton meters. The torque transducer ceased to function during testing under normal operation. We were unable to continue testing and are waiting for the device to be inspected and serviced by Himmelstein.
LabVIEW Panel[edit | edit source]
The final human machine interface in LabVIEW displays all captured measurements simultaneously.
LabVIEW front panel view
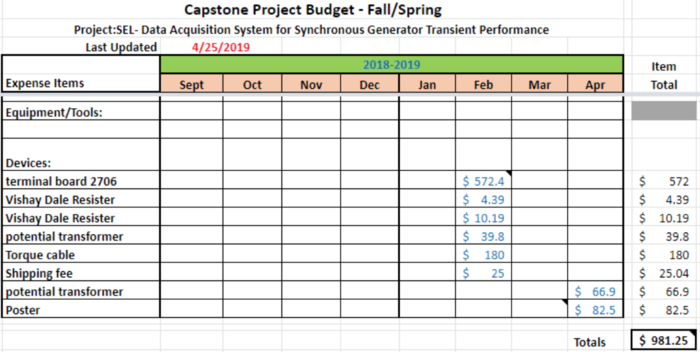
Budget[edit | edit source]
Project Learning[edit | edit source]
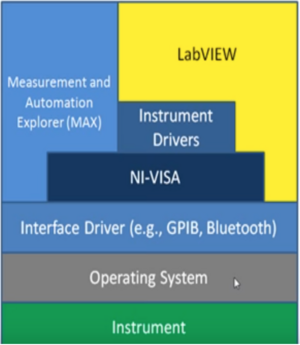
LabVIEW is the software platform allowing us to communicate, configure, and display data from National Instruments devices. It has the ability to communicate with a DAQ using instrument drivers VISA or interface driver.
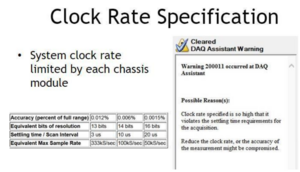
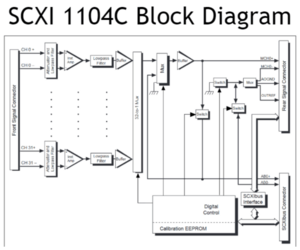
The data acquisition boards share the maximum sampling rate across all channels. Adding more input channels will reduce the maximum available sampling rate.
The following block diagram shows the sampling logic of the SCXI. A multiplexer cycles through each input buffer, causing a slight timing skew between channels.
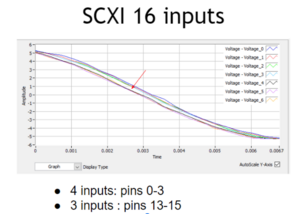
In order to determine the timing skew, we input the same signal into channels 0-3 and 13-15. The error was later determined to be negligible for our purposes.
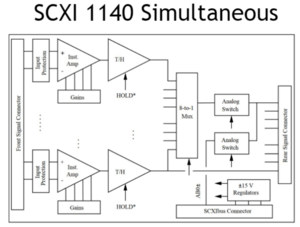
If the error was of significance, we found a solution in a different type of SCXI. This device trigger holds each input for the multiplexer. This has the effect of perfectly simultaneous sampling at the cost of reduced sampling rate.
Team Members[edit | edit source]
Additional Documentation[edit | edit source]
Team Contract
Meeting Minutes
Presentations
File:Prew designreview1.pdf
File:PREW designreview2.pdf
File:Prew snapshot1.pdf
File:PREW snapshot2.pdf
File:PREW snapshot3.pdf
File:PREW expo.pdf
