Quail Egg Image Analysis
| 2020-2021 Capstone Engineering Project | |
| Sponsor | Children's Cancer Therapy Development Institute |
| Team Name | Quaility Imaging |
| Duration | Fall 2020 - Spring 2021 |
| Faculty Adviser | Dr. Dev Shrestha |
| Client | Dr. Charles Keller |
| Team Members |
|
We are working with the Childrens Cancer Therapy Development Center to help automate testing with quail eggs. This project aims to automate the process of checking eggs for current and future viability during treatment.
Problem Definition[edit | edit source]
Background[edit | edit source]
Preclinical therapies are tested in-vitro (isolated tissues, organs, or cells) and then in-vivo (animal models). In-vivo testing provides more compressive results but is time consuming and costly.
The Chorioallantoic membrane (CAM) of a quail embryos can be used to reduce costs by providing an intermediate step between in-vitro and animal models. Our goal is to improve the tools used for the evaluation of CAM assays to increase reliability by monitoring heart rate, blood oxygen saturation, pH, and angiogenesis.
Deliverables[edit | edit source]
Our goal is to create an automated system that monitors viability parameters of quail embryos in six-well plate for the use in cancer drug therapy tests.
This device must be able to determine heart rate, oxygen saturation, pH monitoring, and CAM blood vessel area and branch point counting, while also using minimal to non-invasive, using aseptic techniques. This also needs to be able to communicate with a desktop application for easier and faster use.
Specifications[edit | edit source]
IACUC Approval[edit | edit source]
The Chicken Embryo Guidelines were established by IACUC to ensure that when using quail eggs, there is no accidental hatching without an approved IACUC procedure in place. According to our letter of intent, we wanted to use the quail eggs up to the usual quail hatching timelines, which vary but range about 18 days. Furthermore, partial exposure/shell elimination increases the risk of premature hatching. The committee concluded that an IACUC protocol is required for our work to be completely accepted. In the event of accidental, premature hatching, having prior permission would preclude any publication or inability to disclose the test findings.
Sensors[edit | edit source]
The device should determine the following metrics by a combination of touch-free or minimally-invasive, aseptic electrodes.
- Heart rate
- Oximetry (oxygen saturation)
- Angiogenesis Quantification (Vessel Branch Counting)
These results need to be viewed and parameters modified from an intuitive interface.
Imaging can be taken from above or below using visible or near-infrared light. Nothing should touch the internal components of the plate if possible. Components should have minimal luminescence or light-scattering.
The device should keep its environment within the following parameters to support normal incubation of Coturnix Japonica:
| Temperature | 37.5° ± 0.3° C |
|---|---|
| Humidity (Days 1 – 14) | 45% |
| Humidity (Days > 14) | 55% - 70% |
Design Considerations[edit | edit source]
All processes must be conducted as non-invasively as possible to avoid affecting the eggs development. The measurements should be taken with as little human involvement as possible. In an ideal scenario, this design will be fully automated, only requiring intervention based on its output.
We have looked at a number of different sensors and ways to apply them. We are using using NASA’s Vessel Generation Analysis (VESGEN) Software for vessel branch counting. Acoustocardiography and Ballistocardiography for heart rate, and image processing for a pH sensor.
Andiogenesis Quantification[edit | edit source]
Measuring the growth and formation of new blood vessels in Chorioallantoic Membrane (CAM). The following parameters can be measured:
- Dv Vessel Diameter
- Nv Vessel Number Density
- Bry Vessel Branch Point Density
- Lv Vessel Length Density
- Av Vessel Area Density
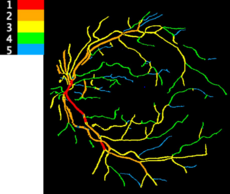
VESGEN is a software developed by NASA that maps and quantifies vascular networks. It accepts grayscale or binary images, converting the grayscale images to binary using a machine learning approach that finds vascular patterns. This software is used by NASA to assess the risk of visual impairment within astronauts before and after flight. It is made available for other uses via the NASA Technology Transfer Program. We can use this software for Angiogenesis Quantification, in other words: measuring the development of blood vessels within an embryo.
VESGEN can grant us many useful metrics to do this including the number of branch points where vessels diverge, and the diameter and length of these branches. Before a recent update to the software, images needed to be converted to binary before processing. Now VESGEN only requires an image converted to grayscale, which is a simpler and more accurate conversion. It can then internally convert the image to binary by searching for common vascular patterns. Converting an image to binary by other means often leaves additional information not related to the vascular network, allowing for less obfuscated and inaccurate results.
The image capture process simply requires still images taken from a directly overhead position. A single source of light in a consistent position is beneficial to providing a uniform image. The output of the software is given in pixels, but can be easily converted to tangible values. This is calculated as a function of the cameras field of view, the distance from the lens to the surface of the embryo, and the resolution of the taken image. The quantification of branches and branch points is relative and does need conversion. This information can then be stored and compared to other measurements to quantify the embryo’s angiogenesis.
spO2 Monitoring[edit | edit source]
spO2 monitoring measures the oxygen saturation in the blood. This is accomplished by measuring the relative absorbance between oxygenated and unoxygenated blood. The relative absorbance is measured using two LEDs (the LEDs used are typically Red and infrared, or Red and Blue LEDs). The two different wavelengths measured the optical absorbance at 660nm and 940nm (infrared). Due to the binding of oxygen to the hemoglobin, originated blood shows a higher absorbance of light within the infrared spectrum and a lower absorbance at 660nm. The total blood oxygen saturation is given by a ratio of the oxygenated hemoglobin to the total hemoglobin within the blood.
The sensor readout is given as a periodic waveform due to changes in blood-oxygen concentrations as the heartbeats. From the relative optical absorbencies, heart rate can be determined based on the relative changes in blood oxygen saturation. For the senor, these fluctuations can be visualized as troughs in the absorbency. The frequency of troughs corresponds to the amount of atrial blood present (deoxygenated), which changes with the heartbeat. This allows for a readout of the peaks as blood oxygen saturation and trough frequency as heart rate.
To monitor the spO2 heart rate of the quail embryos, we used a Spark fun Sp02 sensor. Part of our reasoning for choosing this sensor was its effectiveness and simplicity. For this sensor, in particular, we were able to modify code from Spark fun’s open access bio-sensor library in Arduino. The spark fun Pulse Oximeter and Heart Rate Sensor utilized MAX32664 Biometric Sensor Hub and the MAX30101 Pulse Oximetry and Heart Rate Module. The MAX30101 Pulse Oximetry and Heart Rate Module is a photoplethysmography sensor that measures the absorbance from the built-in LED, while the MAX32664 Biometric Sensor Hub is a Cortex M4 processor used for internal data analysis. The advantage of using the spark fun sensor is that it provided an easy-to-use interface between Arduino and Max Integrated, which allowed us to easily control multiple sensors and data outputs using an Arduino mega. Some disadvantages of using this sensor were its lack of flexibility and size. The placement of the LED wasn’t adjustable, and the sensor had a significant lag time between sensor placement and readout making it more vulnerable to movement due to how peak detection was processed within the Arduino library.
Earlier on, our team also identified MAX86140EVSYS# as a potential for further spO2 sensor development, due to its flexibility and multiple LED configurations. Although we looked at the potential for using this sensor for our capstone, we struggled with its harder-to-use user interface and need for code development. In particular, the potential need to develop a MATLAB code for data processing and sensor calibration (this aspect of development and use was unclear due to the evaluation software from Max integrated and similar Cortex M4 processor to the spark fun sensor). When using the evaluation kit software, we were able to easily able to change the LED configurations but were not able to receive Spo2 and heart rate values as direct outputs. Instead, the relative absorbance can be exported to an excel document, and then the AC and DC values of the waveform can be interpreted from Excel. This method of evaluation would have to be completed after sensor measurements were taken. More CS development for integration into the user interface, as well as to receive real-time absorbencies are needed to be viable for future use. Because of this, we felt that it would be better suited as a further iteration of the project. Overall, This sensor would be a great future direction due to its greater flexibility and sensitivity. The adjustability for both LED: configuration and placement, could be beneficial in counteracting some of the weaknesses of photoplethysmography such as variations in data outputs due to blood pooling, pigmentation, and movement. Future directions needed to use this sensor would be: code development to read spO2 and heartrate from the relative absorbencies.
Heart Rate Monitoring[edit | edit source]
Acoustocardiography[edit | edit source]
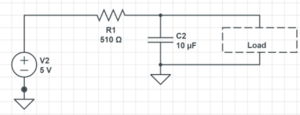
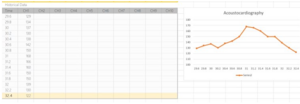
Acoustocardiography uses sound to pick up heart rate. Each time the heart pumps blood a sound is generated as part of lost energy. Audible sound is relative to distance so exact frequencies and decibel levels for different functions are difficult to parameterize. The estimated decibel range for a human heart lies between 45dB and 75dB[3]. Assuming a linear system for heartrate a ratio between the relation of heart mass and body mass between chickens and humans was calculated. Chicken averages where used as there was no information on average heart mass for quail. The average chicken heart was 7.654g and the average mass of a Booted Bantam chicken was 861.862g. The average heart mass for a American female was 284.7g and the mass of the body was 77110.7g. The respective ratios were calculated to be 0.0088812 and 0.0036921. The ratio from chicken to human was derived to be 2.405. The new dB level of a chicken heart was found by dividing the human heart decibel level by 2.405. The new audible range was 18.707dB to 31.179013dB. This range was used as a starting point for what frequencies to design the device around. To account for a large error margin in masses and ratios between different species 30Hz was set as the maximum frequency to test. A low pass filter was designed using Eq.2. A capacitance of 10 µF was chosen and fc was set to 30Hz to find a resistor value of 510Ω. The corresponding transfer function for this filter was found by taking a Laplace transform of the circuit in Fig.1. The transfer function is shown in Eq.3. Equation 3 is derived by setting F(s) = Vout/Vin where Vout is the voltage across the load and Vin is the input voltage. Vout is 1/R*C and Vin is defined by s+1/RC. The transfer function can be used to find the frequency response of the filter and can be altered depending on what frequency range is needed.
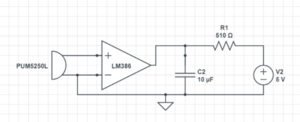
The basis for the acoustocardiography instrument is a microphone that is able to capture low frequencies. Another important aspect to consider is noise caused by power supplied to the microphone. To reduce noise and ensure the frequency spectrum was met an electret microphone PUM-5250L was chosen. The electret microphones uses a capacitor rather than an inductor. This allows the microphone to operate without a polar power supply. This particular microphone was chosen due to its sensitivity (-50dB) and large range of frequency response (30Hz – 15kHz). To capture lower frequencies an amplifier was used in concert. Multiple amplifiers were tested including the AD623N which is a typical instrumentation amplifier however for validation purposes the LM386 amplifier was used since it has up to 200 times adjustable gain. The LM386 is a potentiometer based making the gain easily adjustable. The low-pass filer was implemented with the microphone and amplifier.
To add additional amplification through mechanical vibration a stethoscope head was attached to the microphone. The system was them controlled by an Arduino Mega. The system communicated via serial communication and the digital pins were used to read the microphone output. Code was developed through the Arduino IDE to start serial communication and read voltage output generated by the microphone system. This data was output to a serial plotter tool within Arduino and tested on a human subject to ensure the system was working.
Since complete validation of this system was not possible a separate instrument with an AD623 operational amplifier was used in conjunction with the filter, stethoscope head, and a different microphone. The premade microphone (LM393 Sound Module) has a built in operational amplifier and outputs analog and digital signals. The AD623 has a variable gain controlled by a resistor placed between pins 1 and 8. The gain can be found by using the given equation in the datasheet. R_g is the value of the resistor and G is the gain. The max gain is 1000 which will use a 100Ω resistor.
Ballistocardiography[edit | edit source]
Ballistocardiography is the measurement of the ballistic forces generated by the heart. As the blood pumps from the heart through the descending aorta, it produces an upwards recoil force. This movement produced from blood in the aorta is recorded as the heart rate produced. In order to measure this movement, we used a piezoelectric sensor. This sensor uses the piezoelectric effect, which is the ability for certain materials to produce an electric charge in response to a mechanical stress. The sensor then measures the voltage, with a higher voltage to correlate to a higher stress, into readable data. By using this type of sensor, we would be able to measure the heart rate using a noninvasive technique.
Using the paper “Development of Heart Rate in the Precocial King Quail Coturnix Chinensis” published in The Journal of Experimental of Biology, we were able to put in similar amplification both through code and a through the sensor chosen. This would allow us to get the into a low enough frequency and reading to detect and quantify the heart rate of the embryonic quails. While the King Quail is smaller than the Japanese Quail, we created a system that could be upscaled when needed. The sensor chosen was the “Gravity Flexible Piezo Film Vibration Sensor SKU SEN0209”, also referred to as a “DFROBOT SEN0209”. This sensor has an on-board sensitivity adjustment potentiometer, that was used to decrease the output threshold to a 0.06-0.12 Hz reading, with the possibility to read a lower frequency a possibility. This range was chosen due to the paper mentioned above finding the average from quails to be 0.088Hz. This system was then controlled using an Arduino Mini with its own power source to further reduce noise created. This sensor was used and calibrated to cancel the noise while inside our incubator, however further validation was not able to continue due to factors outside of our control and knowledge.
pH Monitoring[edit | edit source]
pH is a measure of acid and bas content in a solution. The range goes from 0 to 14, with 7 being neutral. pH of less than 7 indicate acidity, whereas a pH of greater than 7 indicates a base. The pH is one of the measurements that is important to determine the viability of the quail embryo. The optimum pH for embryonic development during the first few days of incubation is between 7.9 and 8.4. The huge difference in the pH of the quail embryo can indicate whether the embryo is growing or not.
Atlas Scientific's EZO ORP (oxidation-reduction potential) sensor was used to measure the pH. The pH sensor was calibrated using Atlas calibration Arduino code and calibrated. The Arduino based circuit could detect the pH but it was not used to measure the pH of quail egg. pH strips and pH dye which provided identical result with pH sensor was used to avoid contamination caused by the probe.
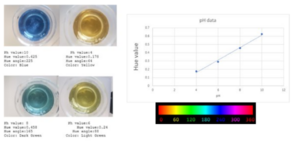
We have been using pH dye for the continuous monitoring of the quail egg pH.
After putting the dye, the egg was incubated and the change in color of the pH dye was observed by the camera mounted on the top of the incubator. Some data was observed by the camera. A video of an observation can be found via this link.
As per the observation, the blue color of the pH fades away as the egg is growing and once the molding starts and cell undergo necrosis the color reappears. One of the hypotheses was as the color fades for the pH, when the carbon dioxide from the air dissolves in the solution, carbonic acid, a weak acid is formed that contribution drives the pH down enough to cause the color fade.
Future Direction[edit | edit source]
- Further validation of dye color changes should be performed with multiple embryos.
- Image processing in MATLAB should be done for better visualization of color change. Some of the image processing tool that were used are RGB color detection and hue value determination.
- 0.45 um of filter can be used to make the dye as sterile as possible.
Hardware & 3D Designs[edit | edit source]
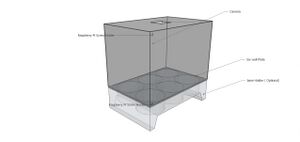
The 3D design presented a unique challenge due to the small area of the six-well plate used for the incubation of the embryo. The goal of our 3D design was to determine optimum sensor placement for the SpO2, acustiocardiograph, and piezoelectric sensor without obstructing the view of the mounted camera used for VESGEN.
One overarching concept within the 3D design was the utilization of a mounted camera. Originally, we wanted to use a raspberry pi microcontroller and camera for the sensors and camera. To address this issue, we originally proposed using a design with an adjustable height. This would allow our design to be compatible with multiple camera types. To do this we first used a shelf system and then modified it to a motor/screw design. Although the adjustable height allowed for more versatility in the camera able to be used, we felt like a static platform would allow us to simplify our design, and focus on sensor placement and sensor contact.
Sensor contact and placement also provided a unique challenge to the project, and something we tried to address throughout each iteration of our 3D design. As mentioned before one of the major design criteria was being able to place sensors around the embryo in a way where each sensor can collect data, without obstructing the view of the aerial camera.
One of the main challenges for sensor placement was having uniform sensor contact and placement when switching between embryos. We first tried to address this issue of uniform contact by having a spring under the platform and suspended well. One advantage of this design is that it would allow for noise dampening due to the suspension of both the cup and sensor. Our team felt like using a suspension-based system, would be beneficial for the piezoelectric sensor to reduce vibration and noise interference.
Final Design[edit | edit source]
One challenge with this design would be the possible need for vessel modification. Modification of the vessel would be needed to create a lip to hang over the edge of the O-ring on the top of the cup seen in the left image. The challenge of this is that any material used for vessel modification would have to be transparent with minimal refraction to be compatible with the sp02 sensor mounted under the well plate. This eliminates using 3D printing, and machining techniques that would scratch the surface. Although we felt like using a suspended system might be beneficial, we wanted to find a similar 3D design that wouldn’t require vessel modification and adjustments of the spring constants since we felt like it would allow for easier part replacement and integration into current incubation procedures used by our sponsor.
Because of these concerns, our third prototype utilized a statically mounted camera, removable cup, and foam sensor platform. The benefit of this is that it allowed us to move away from a suspended well and spring but still allowed us to maintain uniform sensor contact. The foam sensor platform also allowed us to work around some of the spatial constraints, we had with embryo placement by allowing for interchangeability of the sensors. This allowed us to maintain optimal sensor placement while still allowing for cross-validation from multiple sensors. It also allowed us to maintain a more aseptic environment by allowing for the full disassembly of the 3D design when cleaning.
Because we were not able to validate our design and sensors, having an additional iteration to potentially adjust the sensor platform would be beneficial. Each of the prototypes was also only 3D printed. Another future direction would be to focus on materials and manufacturing for a more withstanding design.
User Interface & Sensor Integration[edit | edit source]
Every sensor except for the overhead camera is connected to a System on a Chip (SoC). Our team used an Arduino Mega 2560, but any other standardized device can interface with the sensors. The code for each sensor was compiled together to provide a universal firmware. The code for this can be viewed here. The sensors will likely need additional calibration and input filtering/normalization, but this process is not possible without an implementation environment. For instance, we may poll a sensor more frequently and average the results over time to provide a smoother curve or identify regular spikes / anomalies and normalize them. The most common source of this interference is from electrical interference on an ADC or analogue signal, or noise or other factors from a sensor’s physical environment.
The SoC outputs the sensor values over a standard serial connection using UART. A generic example of this format is:
DataA,DataB,...,DataN<endline character>
This information is received by a PC Running Windows 10 with Microsoft Office installed. The data is then parsed by the Data Streamer plugin for Excel. Initially this simply places the data and respective timestamp into a .xlxs file. From here it can be presented through any desired graph, visualization, or function that Excel supports. Historical data can be stored in separate, static Excel files to be referenced in the future and compared to more recent results.
The data streamer plugin can also send values back to the SoC over UART. This is useful for adjusting metrics such as the polling rate of the sensors and any sensor specific calibration settings. As calibration was not yet possible, this functionality was not used, but may be useful for any future implementations.
Project Learning[edit | edit source]
Our group was not able to calibrate or validate any of the sensors. The main reason was due to the necrosis of the embryo. Only one of the embryos lasted till 5 days, so data was only obtained from pH dye. All sensors are capable of providing readings, but they need to be calibrated and validated with the shell free quail embryo. Signal processing on the senor may provide better data in the future. Signal processing removes unnecessary components or features from a signal. Low-pass, high-pass, band-pass filters can be used for cutoff frequency and order (steepness).
A full user interface would also be beneficial for both calibration and comprehension of the output. An interface designed to display the most necessary information would be more intuitive than the current solution, which must operate within Excel. The Excel add-on used allows passing values back to the sensors, but in a rudimentary way that could also be much improved with a dedicated user interface. A final consideration is the advantage of constructing the data within a proper database with the manipulation capabilities of SQL, rather than a CSV format.
Optimization of sensor integration would also be useful, but again relies on sensor validation. The sensors would run on a real time operating system instead of a simple delayed loop. As different sensors may require varied polling rates, this would save running time and be especially beneficial to a battery driven system.
Team Members[edit | edit source]
|
Major: Biological Engineering |
|
Major: Biological Engineering |
|
Major: Biological Engineering |
|
Major: Computer Science |
|
Major: Computer Science |
|
Major: Biological Engineering |
Additional Documentation[edit | edit source]
Presentations
