Kodiak Oil Film Interferometry & Load Cell Airfoil Testing
| [[File:|300px|center|alt=]] | |
| Sponsors | Kodiak Aero |
| Team Name | Slick Aviators |
| Duration | 2022-2023 |
| Faculty Adviser | Dr. Vibhav Durgesh |
| Mentor | Anas Nawafleh |
| Client | Brandon Stille, ENGINEERING MANAGER – KODIAK DEVELOPMENT & DESIGN – SANDPOINT |
| Team Members |
|
This capstone project aims to quantify the impact of universal head rivets on the aerodynamic performance of the horizontal tail airfoil on their aircraft.
Project Plan[edit | edit source]
The team was comprised of three team members. Ryan Schaefer was involved with 3D designing and printing the airfoils; responsibilities including scaling the pattern of the rivets per unit length. Brendyn Goodwin designed the two adapters that helped secure the airfoil in the wind tunnel when performing tests. Shalom Masango was the project manager who was additionally involved in the theory values of lift and drag at various Reynolds numbers, oil-film interferometry theory and post processing of wind tunnel experiments. The project schedule deviated as unforeseen challenges presented themselves. The first semester was dedicated to project learning, understanding the set parameters of the wind tunnel and the equipment, as well as designing the airfoils and adapters. Initial experiments were conducted at a Reynolds number of 3 x 10⁵ using a 6-inch smooth airfoil. Load cells and oil-film interferometry experiments were done on the 6-inch smooth airfoil to validate the results before 3D printing.
The following semester was reserved for 3D printing the two airfoils, manufacturing the adapters in the Machine Shop, and running tests. Three wind tunnel tests were carried out at a Reynolds number of 3 x 10⁵, 4 x 10⁵, and 5 x 10⁵ with the two airfoils. Three trials for each Reynolds number were conducted in the wind tunnel to validate the results generated. Single trials were run at 1 x 10⁵ and 2 x 10⁵ to see the stalling characteristics of the 9-inch airfoil. In addition to this, we visited the Daher facilities in Sandpoint to understand the processes of manufacturing aircraft as well as identifying potential issues and challenges for future project development, such as mounting an OFI setup on the aircraft.
Problem Definition[edit | edit source]
The primary objective of this project is to design an experiment to test the impact of a riveted surface found on the horizontal stabilizer on a Kodiak aircraft. To achieve this, two sets of experiments have been designed to analyze the coefficients of drag, lift, and skin friction:
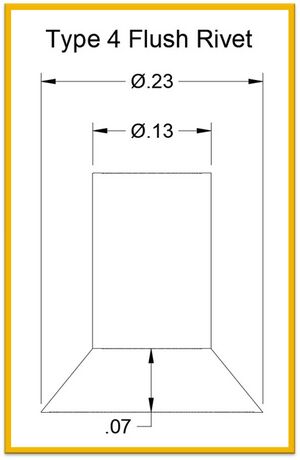
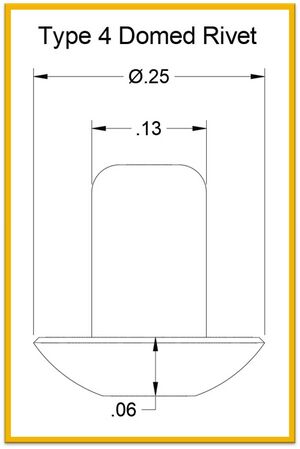
-9-inch NACA 0012 airfoil to reach a Reynolds number of ~5 x 10⁵ with
o Type 4 flush rivets
o Type 4 domed rivets
A smooth airfoil is used as a baseline to compare and evaluate if it corresponds with theoretical data. OFI experiments give a better understanding of how flow visualization compares between smooth and riveted airfoils. From this, the fuel efficiency of the horizontal stabilizer will be quantified. This will aid in the decision making of the company regarding methods to reduce drag on the horizontal stabilizer. A testing fixture was designed and built to perform OFI experiments on the two different airfoils, allowing for the study of flow visualization. Overall, the success of this project will be determined by the ability to accurately measure and compare the performance of the two different airfoil designs using separate techniques.
The ultimate stage of the project was designing an OFI mounting fixture on the Kodiak test aircraft itself. The flow-visualization results from the flight test were compared to the results found in the wind tunnel tests to demonstrate the large-scale applicability of the test results.
Background[edit | edit source]
Different types of airfoils are used to optimize lift, drag and stalling characteristics. Daher uses a NACA 0012 airfoil on the horizontal stabilizer with different types of rivets. Aircraft rivets are used to hold aluminum sheets, secure fittings, nut plates, spars, and ribs. Rivets are light and cheap as they do not require electricity or specific conditions to function, as opposed to welding, for instance. [1]. In addition, rivets are used to subdue stresses from various atmospheric conditions.
The main two types of rivets used on a Kodiak aircraft are standard-sized pulled and over-sized pulled rivet holes. The Standard Dill ID callouts for these rivets vary from 3-8. Daher seeks to know the impact of standard versus smooth rivets on their aircraft. The Mechanical Department at the University of Idaho has an 18-inch Open Circuit Wind Tunnel where experiments can be designed and conducted. The team scales down the real-size airfoil to fit the parameters of the wind tunnel without compromising airfoil design. Experiments are conducted at various Reynolds Numbers using a 9-inch NACA 0012 airfoil. A series of trials compares riveted and flush airfoil surfaces. The data collected will help the company make a decision regarding aerodynamic performance of future designs.
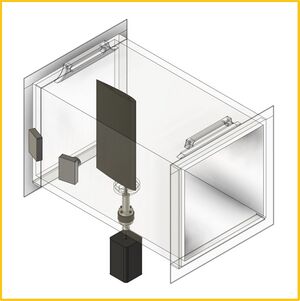
Kodiak Aircraft uses standard head rivets on horizontal wings. Load cell wind tunnel experiments are to test differences in drag and lift while Oil Film Interferometry tests are to determine the differences in surface skin friction. By constructing accurate, scalable models of the airfoil the efficiency of each can be tested via wind tunnel. The foil is fixed vertically inside the testing chamber. A load cell measures forces and torques experienced by the airfoil. Facilities & Equipment Principle, initial experiments were conducted in an 18-inch, Open-Circuit Wind Tunnel. Flow is conditioned with a honeycomb and screen pack through which ambient, room temperature air, is conducted through the testing sections. The air flows through a rectangular section (18x18x36-inch) of 3/4-inch thick plexiglass where the mounted NACA-0012 airfoil model can be optically observed. Max airspeed is measured at 100mph, driven by a 48-inch Axial Fan. The airfoil being tested is mounted to a Nema42 2830 stepper motor and an ATI F/T Gamma load cell sensor. The stepper motor has a **1.8 degree dimensional resolution** which is electronically turned to test different angles of attack (AOA) as would be experienced by the airfoil in a realistic scenario. Mounted between motor and airfoil interfaces the load cell; used to measure simulated lift and drag experienced by the airfoil at different angles.
Theory[edit | edit source]
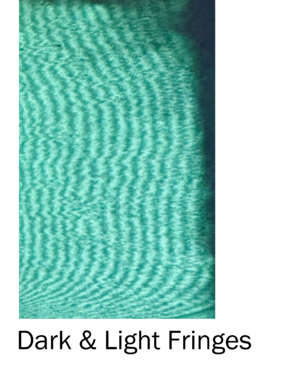
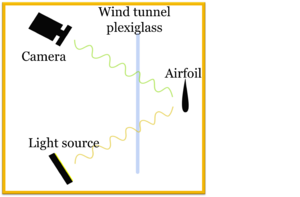
Oil film interferometry is a technique used to study the behavior of fluids and gases. It works by using an oil film to create interference patterns that can be analyzed to gain insights into the physical properties of the fluid or gas being studied. The OFI (Oil Film Interference) experiments determine the Coefficient of Skin Friction of an airfoil in a wind tunnel. The airfoil is stationary and has a line of oil applied to its leading edge, which is spread by the wind. Fringes are formed on the surface of the airfoil, which are visible through a camera and light setup. By analyzing these fringes, the Coefficient of Skin Friction can be determined.
The basic setup for oil film interferometry involves placing a thin layer of oil on a flat surface, such as a glass plate. A light source is then directed at the oil film at an angle, which causes the light to reflect off the surface of the oil film and create interference patterns. These patterns can be visualized using a camera or other imaging device and analyzed to extract information about the properties of the fluid or gas in contact with the oil film.
One of the main applications of oil film interferometry is in the study of fluid dynamics. By analyzing the interference patterns created by the oil film, researchers can gain insights into the behavior of fluid flows, such as the formation of vortices, the mixing of fluids of different densities, and the effects of turbulence.
Budget[edit | edit source]
Total budget for this project was $1,750, provided by Kodiak Aero. Expenditure priorities were given to the production of the two airfoils, costing $1,034 to 3D-print to the required tolerances. Additional, lesser costs consisted of presentation fees ($90), travel fees ($200), and prices for machining experiment equipment. Expenditures were conservative in nature as additional measures were taken to save money, such as using scrap aluminum or saving money by not hiring a machinist.
Model Creation & 3D Printing[edit | edit source]
Airfoil modeling all begins with categorizing the NACA type airfoil chord for this project, which indicates the side-profile geometry of the wing. Some wings are symmetric about the top and bottom, while others are unsymmetric; this creates different aerodynamic performance characteristics based on application. The airfoil we analyzed has a 12% thickness of the overall chord length of the wing.
The main design parameters considered were weight, loads (lift, drag), printability, cost, blockage, and how closely model aerodynamic surface conditions could be replicated (determined by Reynolds number).
Since the wind tunnel test chamber is 18’’ in diameter, a total model length was set at 17.5’’ for appropriate clearance. Another parameter to consider in the wind tunnel was blockage, which is the ratio of the airfoil area that blocks the test chamber to the original width (18’’). This blockage needs to be minimized to create predictable aerodynamic test conditions. The larger the airfoil, or angle of attack, the larger the total blockage. The chart below shows the calculated blockage, based on a simple math model, compared to a CAD driven analysis.
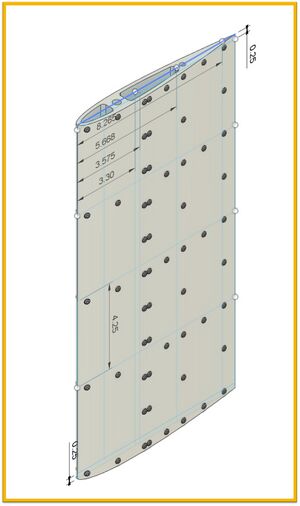
A scale model of the airfoil was calculated by inserting a canvas into CAD software package. A canvas is a document that can be uploaded to the work space that serves as a blueprint for design work; the engineering drawings provided by Kodiak aircraft worked well for this purpose. Once inserted into the workspace, selectable points were enabled on the surface of the canvas, which allowed for measuring and scaling. Since the provided drawing labeled the original aircraft chord length as 40’’, the canvas was scaled symmetrically until the real-time rendered dimension was true to the aircraft. From there, each dimension was measured and recorded for project learning purposes about the original aircraft.
The next step was shrinking the canvas symmetrically by scaling down by .225, which resulted in the desired model chord length of 9’’. Each dimension was measured again, such as the distance between ribs and rivet strings. Most dimensions were measured from the leading edge of the airfoil. Then all of the dimensions were exported into a separate assembly file where the rivets and blank airfoil would soon join.
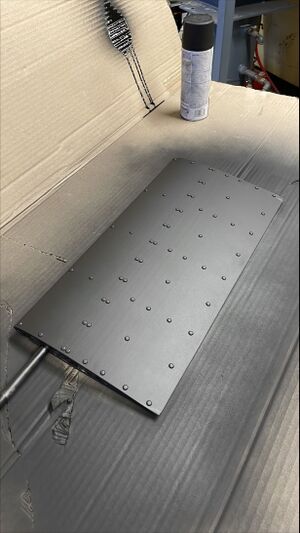
The density of rivets, measured in rivets per inch, was kept to scale between the airplane and the model. This consistency maintains aerodynamic similitude on the surfaces. Over 90% of the rivets used to fasten the skin onto the airplane are type 4, which means it has an affective shank diameter of 4/32 of an inch. The rivets were patterned onto the airfoil surface at correct scale, while considering tangent error.
The modeled airfoil was estimated to weigh ~1175 grams, which exerts a force in the Z direction on the loadcell of ~11.5 Newtons. This is well within the operating parameters of the testing apparatus. Other considerations made to accommodate testing from a design standpoint include capping the top of the airfoil so the metal rod will not slide through, and creating a hole for the airfoil and rod to be pinned together. This design prohibits the airfoil from rotating around the rod while experiencing torque due to aerodynamic loads.
Prototypes[edit | edit source]
Airfoil selection influenced the design of the experiments, and targeted parameters from which to collect test data. The most significant design criteria required replicating the aerodynamic conditions on the surface of the Kodiak aircraft's tail section. Considering that the wind tunnel on campus provides a finite maximum wind velocity, the aircraft’s slowest cruising speed (60 knots) became the targeted condition to emulate. The Reynolds number was used to verify similitude between the targeted, real-world condition, and wind tunnel conditions. Manufacturing an airfoil with a longer chord and testing at a higher wind velocity would reach the targeted Reynolds number.
3D Printing[edit | edit source]
Existing, 3D printed airfoils in the wind tunnel of 6-inch chord length served as a starting reference. Dr. Vibhav Durgesh counseled to consider larger airfoils: 9-inch and 12-inch chord lengths. These chord lengths allow for achieving a higher Reynolds number of 500k, creating non-transitional conditions that scale well. Therefore, the optimization of the design selection needed to favor a high Reynolds number to represent real-world conditions best.
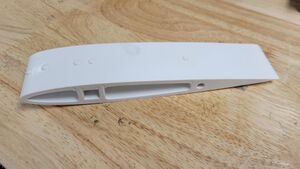
Smaller prototypes were printed first, testing the 3D Resin Strata Printer located on campus. It was originally planned to print all airfoils on-site, to gain the advantage of control, and eliminate the need for shipping. The Riveted Surface Airfoil was first printed, to mediocre - yet acceptable - results. The Smooth Surface Airfoil was deemed unacceptable as the 3D printer nozzle struck the surface of the airfoil while in print. Due to the printer being out-of-order for the next foreseeable months, it was decided to outsource the printing of the Smooth Surface Airfoil. Special precautions were taken to ensure similarity to quality and resolution expected from the in-house prints. Both airfoils were then mounted to the load sensor by inserting a steel tube through the spar, and locking it in place with a cotter-pin.
The length of the print bed constrained the size of the model, and how it would be manufactured. The opportunity for distortion along the leading and trailing edges of the airfoil would also increase proportional to the print length. We designed the airfoil to accommodate a quarter inch gap between each end of the airfoil and the test chamber, resulting in a 17.5-inch span, and a 9-inch in chord. The internal geometry of the airfoil was also influenced by the need to stay within the allocated printing budget. Cavities were created around areas of the model, reducing mass. Additionally, cutting lightning holes along the entire span of the airfoil’s spine (near where the fixturing rod slides in) reduced mass further. These design decisions maintained the model’s structural integrity while reducing the cost of 3D printing.
The ultimate design selection was the largest and most simple design that could feasibly be 3D printed. A riveted surface, 17.5 x 9 -inch single-piece airfoil was printed on campus. Due to the printer on campus being put out of service temporarily, it was decided to export smooth surface airfoil print to the same manufacturers of the printer (StrataSys) with the purpose of maintaining the same print fidelity. To mount these airfoils in the wind tunnel, a steel tube is inserted through the spar, extending beyond the entire length of the airfoil. This tube is then fitted to the appropriate sensor/adapters for experimentation.
Blockage[edit | edit source]
Another design parameter considered was blockage inside the wind tunnel test chamber. This is caused by the presence of the airfoil, and is more influential in larger airfoils, and at more aggressive angles of attack. The blockage ratio of a wind tunnel is a critical parameter that affects the accuracy of aerodynamic load measurements. It’s defined as the ratio of the cross-sectional area of the airfoil to the cross-sectional area of the wind tunnel. A high blockage ratio may significantly interfere with the airflow around the airfoil, leading to inaccurate aerodynamic measurements. Therefore, optimizing the blockage ratio is crucial for obtaining reliable results. One approach to optimizing the blockage ratio is to use airfoils with lower drag coefficients, reducing the amount of interference with the airflow. Another approach is to use a wind tunnel with a larger cross-sectional area to minimize the blockage ratio. Ultimately, optimizing the blockage ratio requires a careful balance between the size of the model airfoil and the size of the wind tunnel test chamber, as well as the choice of surface roughness, to ensure accurate and reliable aerodynamic measurements.
Final Prints[edit | edit source]
Both airfoils are finished with a matte, black surface. This chosen surface finish is necessary to conduct an OFI experiment effectively.
Testing Method[edit | edit source]
The 9-inch airfoil was chosen as chord length and wind speed were the only two parameters that could have been changed to meet the targeted Reynolds number. With a 9-inch chord section and a wind velocity of 33 m/s, a 500k Reynolds number value was achieved.
Reaching this targeted number could have also been possible at a lower wind speed, and a longer chord length, however, this proved to be unpractical as the ability to print an airfoil of such size, accurately, would have led to complicated design issues (namely tolerances in 3D printing), even more exaggerated wind tunnel blockage - affecting the results negatively - and the lack of manufacturing capabilities as the print bed was too small.
Calculating aerodynamic forces on an airfoil involves considering a variety of input parameters, including the airfoil's shape, its angle of attack, air density, air velocity, air viscosity. The lift and drag forces generated by an airfoil are determined by the interaction of these parameters. These models are based on principles of fluid mechanics. Accurately calculating aerodynamic forces was critical to designing airfoils that operated safely in the wind tunnel, without risking damage to experimental devices.
Additionally, this targeted number could have been achieved by running the wind tunnel at a higher wind speed. However, this was soon proven unfavorable due to being restricted by wind tunnel speed, and load cell sensor oversaturation. With drag and lift being a factor of wind velocity, attempting to achieve a higher Reynolds number by running a higher velocity with a smaller chord length airfoil would have resulted in oversaturation.
Preliminary hand-calculations showed that one concern was overloading the electronic load cell, a phenomenon known as oversaturation. The design was too complex to be analyzed by finite element analysis (F.E.A.), so we relied on hand calculations. Scaling up the 9-inch airfoil design resulted in proportionally higher stresses. This also meant that testing performed at higher Reynolds numbers could only occur at a lower range of angles of attack. Fewer range results reduce the confidence in determining airfoil performance characteristics compared to existing published data.
Airfoil design was initiated by using the NACA0012 profile generator by Airfoiltools.com. This, combined with the part file of the previous 6-inch airfoil, eventually lead to the design of a 9-inch chord extrusion 17.5-inches in span.
Wind Tunnel Experiments[edit | edit source]
There are two types of experiments conducted: Load Cell Experiments, and Oil-Film Interferometry Experiments (OFI). Load Cell Experiments are conducted in a wind tunnel to determine the Coefficient of Drag and Lift, while OFI experiments are done to determine the Coefficient of Skin Friction. While both experiments are performed in a wind tunnel, they require different setups and equipment to perform.
The purpose of the Load Cell Experiments is to determine the Coefficient of Drag, and the Coefficient of Lift on the airfoil. This will take place at various Angles of Attack (AOA). The airfoil rotates between +4° and -4° relative to the direction of airflow in the wind tunnel. A stepper motor is used to control this rotation. To determine the forces acting on the airfoil, am ATI Gamma F/T sensor is used. The airfoil, load sensor, and stepper motor are interfaced through several custom-machined aluminum adapters. The airfoil, mounted inside the wind tunnel test section, is attached to the load cell with a steel tube extending beyond the boundaries of the wind tunnel, through the wall. The load cell is mounted on top of the stepper motor. This setup allows for the axis of measurement employed by the load cell to rotate with the angle of attack. This is for simplicity in data recording, and works preventatively against overloading the load cell.
A series of runs are conducted; the first being a 'zero-run' where the wind tunnel operates at '0' velocity. The velocity is slowly increased in consecutive runs, aiming for a targeted Reynolds number increasingly higher (ie. 200,000 300,000 400,000 500,000). The data is collected through a Labview System DAQ and plotted in LabView.
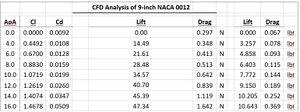
As shown in Figure 5, drag and lift were expected to increase with an increase in the angle of attack. The angle of attack was limited to prevent the occurrence of excessive blockage, and to prevent overloading the load cell (limit 65N). However, the load cell sensor was sensitive to torques as well as forces. Torques were not accounted for in the initial, preliminary calculations. Therefore, at a Reynolds number of 500k, the angle of attack had to be limited further than anticipated to prevent overloading the sensor with a strong torque.
Additionally, to support the larger, heavier airfoils, new adapters were developed for the experimental setup. These new pieces of equipment serve as adapters, interfacing the airfoil with the load cell sensor, and the load cell sensor with the stepper motor. The creation of these new pieces allows for more setup control, more stable testing, and more support for the airfoils and the forces they are subject to.
Oil-Film Interferometry Experiments[edit | edit source]
OFI experiments are used to determine the Coefficient of Skin Friction of the airfoil. The airfoil is fixed mounted inside the wind tunnel, there is no load cell or stepper motor. A small line of oil is applied to the surface, on the leading edge of the airfoil. The wind causes the oil film to spread across the surface. Small fringes (a pattern of discrepancies in height) are formed along the surface. These are viewed using a camera and light setup. The oil film acts as a thin, transparent layer that changes the path length of the light that passes through it. These fringes are visible on the camera. By analyzing the fringes, the Coefficient of Skin Friction is determined.
Results[edit | edit source]
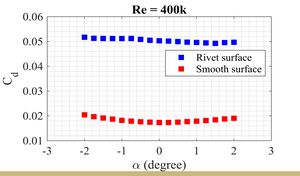
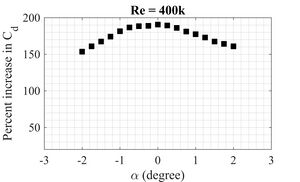
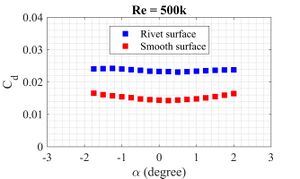
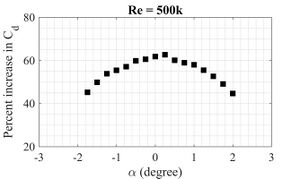
The figures below showcase the relationship between drag and the two surfaces of the airfoil from the load cell tests carried out in the wind tunnel. From these results, the airfoil with rivets has higher coefficients of drag at different angle of attacks compared to the smooth. Expected results are seen at a Reynolds number of 5 x 10⁵, as the plot becomes symmetric. The tables below showcase the percentage increase of drag. The highest drag percentage increase is at 0° for both Reynolds numbers. Flow visualizations need to be done through OFI to understand fully the impact of rivets.
Future Work[edit | edit source]
Future work will primarily involve two tasks: the complete study and analysis of the manufactured Airfoils using OFI experiments and designing a testing apparatus for mounting on the Kodiak Aircraft itself. It is recommended that future students tour the facility early in the design phase of the project, as a knowledge of the aircraft itself will greatly assist in designing an OFI experiment to be performed while in flight. Additionally, a deep understanding of OFI will be necessary to carry out the experiments already designed in the wind tunnel. The following team should also be prepared to design, and 3D print an airfoil for any reason that a new test subject may be needed.
Currently, on the vertical stabilizer on the Kodiak Aircraft there already exists a location where a camera may be mounted on the outside of the fuselage. This camera will either need to be precisely focused on the testing section of the horizontal stabilizer or attach to an extending arm to position in accordingly. A device will need to be developed that can apply a small, even line of oil on the testing section while at cruise speeds. All attachments must be equipped with some form of damping system to reduce vibrations of the aircraft while in testing.
To best facilitate these implementations, it is recommended that dimensional drawings be provided to the following team to allow for accuracy within these designs.
